Analytics
Find out exactly what is costing you stars.
The ReputationIQ score, sentiment and topic analysis, and an AI executive summary tell you what guests love and what's costing you stars, per property and across your group.
- 7-day free trial
- No credit card
- Set up in about 10 minutes
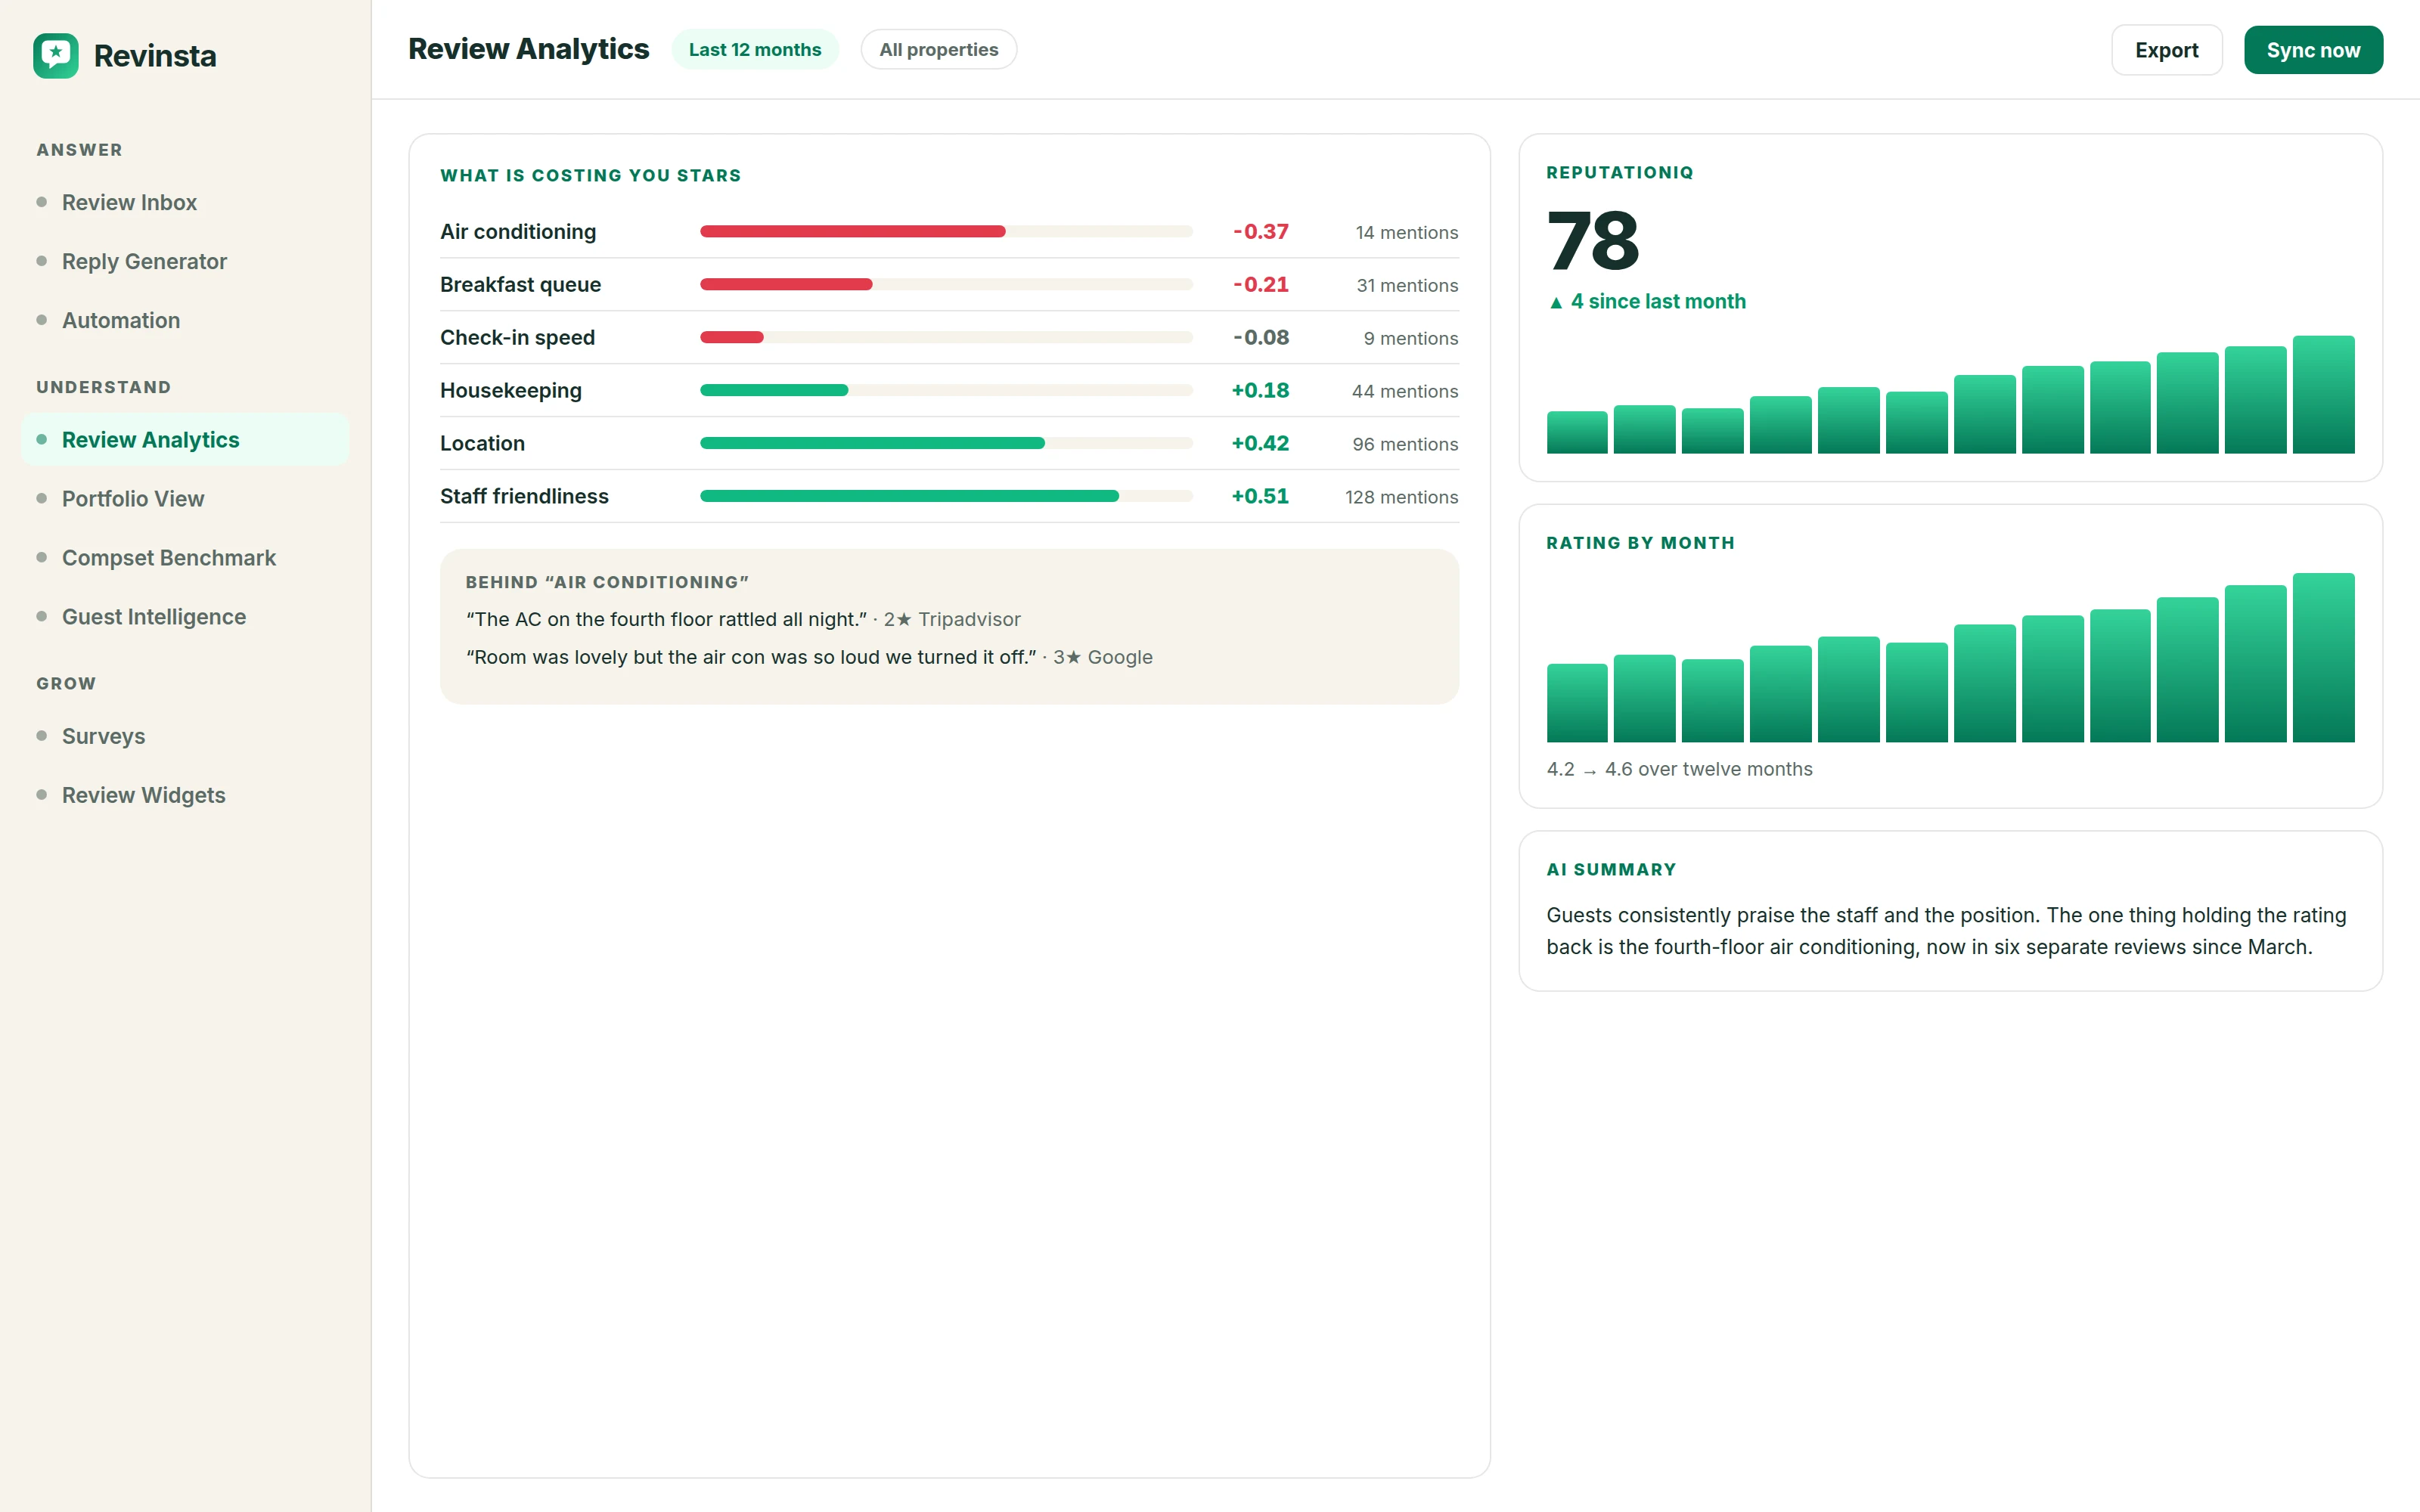
You already have a suspicion about what is holding your rating back. Proving it means reading a year of reviews, and that afternoon never arrives.
Most review tools hand you a category score instead. Breakfast: 62%. That tells you very little - 62% of what, said by how many people, and is it worth a Tuesday morning against the other nine things on your list?
Revinsta puts it in order of what it is costing you, weighted by how often guests raise it, and shows you the comments behind every number. Six people complaining about the same lift stops being a feeling and becomes a job for maintenance.
How it works
Analytics, step by step.
- 1
Every review read and categorised
Sentiment and topic analysis run across your full history, not just recent arrivals, so a pattern that started in March is visible rather than averaged away.
- 2
Categories ranked by impact
Each category gets a rating-point impact - how much it is pulling your average up or down - weighted by how often guests raise it. The list sorts itself into the order you should work in.
- 3
Quotes behind every number
Open any category and read the actual sentences guests wrote. An AI executive summary sits on top: top praises, top complaints, and the quick wins, in language you can forward to an owner without rewriting it.
What you get
Included at every property count.
- Group overview with period-over-period deltas
- Category impact: where you gain and lose stars
- AI summary: top praises, top complaints, quick wins
Questions
About analytics.
A single score for a property's reputation health that combines rating, review volume, recency, response rate and sentiment trend. It exists so you can compare two properties, or the same property month over month, without holding five separate numbers in your head - not to replace them.
A score tells you how a category is rated. Impact tells you how many rating points it is costing you, which folds in how often guests mention it at all. A 62% on something two guests raised barely moves your average; a 74% on the thing in half your reviews is your whole problem.
Yes, and this is the part that makes it usable. Every category opens into the quotes that produced it, so you can check the machine's work rather than take its word - and walk into an ops meeting with evidence instead of an opinion.
Yes. Group overview shows every property with period-over-period movement, and category impact can be read per property or across the whole portfolio - useful when the same supplier or the same policy is dragging three hotels down at once.
Something we haven’t covered? Ask us directly.
Explore more
All features →Review Inbox
Google, Booking.com, Tripadvisor and OTA reviews land in one two-pane workspace.
Read moreBrand Voice
Your brand voice is how your property speaks to guests.
Read moreSmart Snippets
Describe how to handle recurring topics (expensive parking, no vegan breakfast) and Revinsta weaves the right answer into replies naturally, with different wording every time.
Read moreTry Analytics on your own reviews.
Seven days free, everything switched on, no credit card. You’ll know inside ten minutes whether it sounds like your hotel.